Benchmark
Tools for objectively comparing control systems using standard metrics.
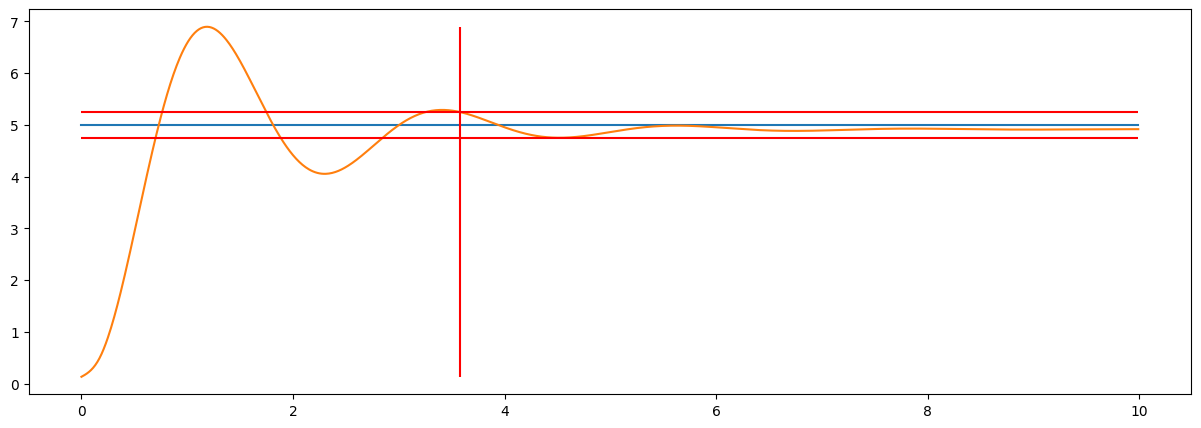
What We Evaluate
- Overshoot
- Settling time
- Damping ratio
- Steady-state error
API
ControlBenchmark

Class for control system evaluation and beautiful plot generation.
Provides tools for analyzing transient process quality in automatic control systems with results visualization.
becnchmarking_one_step = benchmarking_one_step
class-attribute
instance-attribute

benchmarking_one_step(control_signal, system_signal, signal_val, dt)

Evaluate control system on one step and return extended set of results as dictionary.
Parameters:
| Name | Type | Description | Default |
|---|---|---|---|
control_signal
|
ndarray
|
System control signal. |
required |
system_signal
|
ndarray
|
System signal that is affected by control. |
required |
signal_val
|
float
|
Signal value from which the step function begins. |
required |
dt
|
float
|
Discretization step. |
required |
Returns:
| Name | Type | Description |
|---|---|---|
dict |
dict
|
Dictionary with control system evaluation results: - "overshoot" (float): overshoot (%), - "settling_time" (float): settling time (s), - "damping_degree" (float): damping degree, - "static_error" (float): static error, - "rise_time" (float): rise time (s), - "peak_time" (float): peak time (s), - "maximum_deviation" (float): maximum deviation, - "iae" (float): integral absolute error, - "ise" (float): integral squared error, - "itae" (float): integral time absolute error, - "oscillation_count" (int): oscillation count, - "steady_state_value" (float): steady state value, - "performance_index" (float): comprehensive quality index. |
plot(control_signal, system_signal, signal_val, dt, tps, figsize=(1600, 1000), title='Control System Analysis')

Build interactive control system analysis plot using Plotly.
Parameters:
| Name | Type | Description | Default |
|---|---|---|---|
control_signal
|
ndarray
|
System control signal. |
required |
system_signal
|
ndarray
|
System signal that is affected by control. |
required |
signal_val
|
float
|
Signal value from which the step function begins. |
required |
dt
|
float
|
Discretization step. |
required |
tps
|
ndarray
|
Array of time stamps. |
required |
figsize
|
tuple
|
Plot size in pixels, defaults to (1600, 1000). |
(1600, 1000)
|
title
|
str
|
Plot title. |
'Control System Analysis'
|
compare_systems(systems_data, signal_val, dt, figsize=(1800, 1200))

Compare multiple control systems on a single interactive plot.
Parameters:
| Name | Type | Description | Default |
|---|---|---|---|
systems_data
|
Dict[str, Dict]
|
Mapping from system name to a dictionary with keys:
- |
required |
signal_val
|
float
|
Threshold value used to detect the step start. |
required |
dt
|
float
|
Discretization time step used for metric conversions. |
required |
figsize
|
tuple
|
Plot size in pixels. Defaults to |
(1800, 1200)
|
Returns:
| Type | Description |
|---|---|
Dict[str, Dict]
|
Dict[str, Dict]: Mapping from system name to computed metrics. |
generate_report(control_signal, system_signal, signal_val, dt, system_name='Система управления')

Generate a formatted text report with control quality metrics.
Parameters:
| Name | Type | Description | Default |
|---|---|---|---|
control_signal
|
ndarray
|
Reference/command signal. |
required |
system_signal
|
ndarray
|
System response signal. |
required |
signal_val
|
float
|
Threshold value used to detect the step start. |
required |
dt
|
float
|
Discretization time step. |
required |
system_name
|
str
|
Label used in the report header. |
'Система управления'
|
Returns:
| Name | Type | Description |
|---|---|---|
str |
str
|
Formatted report string. |
Usage Example
from tensoraerospace.benchmark import ControlBenchmark

bench = ControlBenchmark()
metrics = bench.benchmarking_one_step(control_signal, system_signal, 1.0, dt)

print("Steady-state error:", metrics['static_error'])
print("Settling time:", metrics['settling_time'])
print("Damping ratio:", metrics['damping_degree'])
print("Overshoot:", metrics['overshoot'])

# Visualize signal comparison and metrics
bench.plot(control_signal, system_signal, 1.0, dt, tps, figsize=(15, 5))
Units and Input Data
control_signal,system_signal— arrays of equal length1.0— desired steady-state value (example)dt— sampling step;tps— time axis
Backward Compatibility
The old method name becnchmarking_one_step still works as an alias for benchmarking_one_step for backward compatibility.